
Uniswap V3 Polygon Breakdowns - State of adoption in DEX (P.9)

The Uniswap community approved the deployment of Uniswap V3 on Polygon in December 2021. Since then the number of swaps per day has been around 65,000  or less (Fig. 64). However in May 2022, this number has spiked, particularly on 11 May 2022, more than 174 thousand of swap was executed with $348.1m of trading volume (Fig. 65). The liquidity providers reaped about $245k of fee (Fig. 66) and Uniswap V3 Polygon gained $240k revenue (Fig.67) at the same time. It was the time when V3 Polygon achieved the most profit ever. Compared with V3 on Ethereum, the popularity of V3 Polygon is still restricted. On the same day, the traded volume of V3 Ethereum was $544m, and a $1.63m fee was generated for LPs. It can be seen that only 1.56 times higher trading volume brought 6.65 times higher LP’s fee in V3 Ethereum. Looking at the Polygon price per trade, except for several days in Jan 2022 with a higher gas fee of more than $0.7 per swap, each transaction on V3 Polygon just costs about $0.115 (Fig.68), quite more economical than on Ethereum. As such, the use of the Polygon network does its primary role in minimizing execution costs. 


Fig. 64 Swap count and the number of users on Uniswap v3 Polygon

Fig. 65 Trading volume of Uniswap V3 Polygon

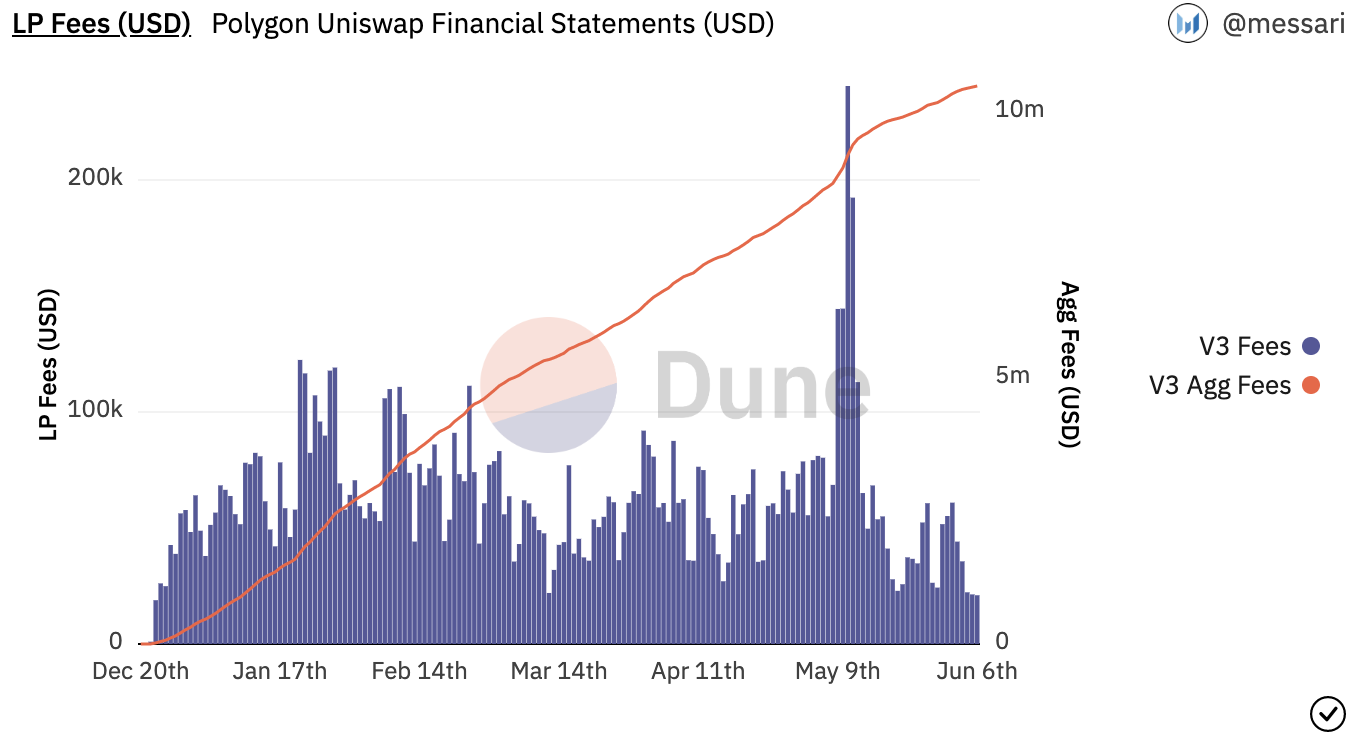
Fig. 66 Liquidity provider fee generated  on Uniswap V3 Polygon


Fig. 67. Total revenue of Uniswap V3 Polygon


Fig. 68. Gas price per transaction on Uniswap V3 Polygon


Pool

Fee

Pool Address 

Volume (USD)

# of TX

1

USDC/WETH

0.05%

\x45dda9cb7c25131df268515131f647d726f50608

$2.89b

1049010

2

WMATIC/USDC

0.05%

\xa374094527e1673a86de625aa59517c5de346d32

$1.67b

1246662

3

WMATIC/WETH

0.05%

\x86f1d8390222a3691c28938ec7404a1661e618e0

$0.869b

733208

4

WBTC/WETH

0.05%

\x50eaedb835021e4a108b7290636d62e9765cc6d7

$0.415b

202047

5

USDC/USDT

0.01%

\xdac8a8e6dbf8c690ec6815e0ff03491b2770255d

$0.119b

174173

Tab. 3. Top market on Polygon Uniswap V3 in the last 90 days (from 5 March to 5 Jun 2022)

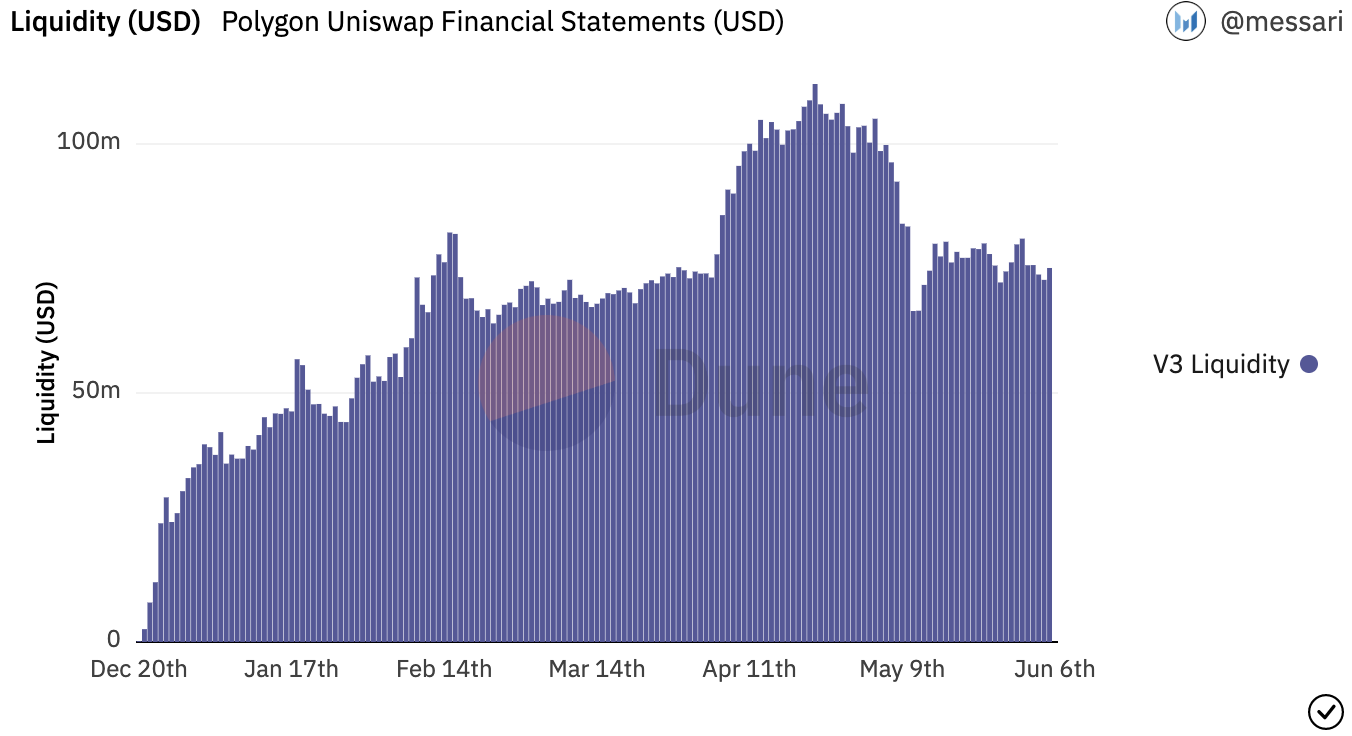
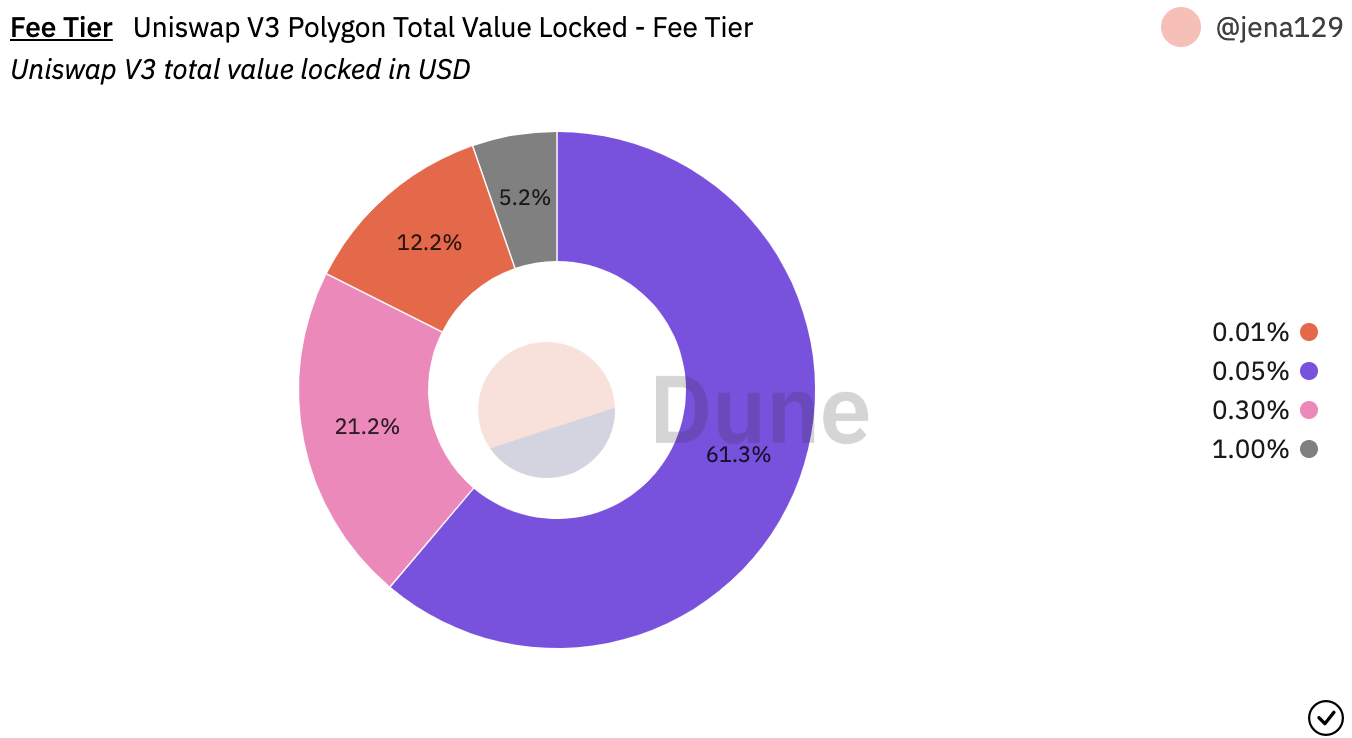
USDC/WETH is the most popular trading pair up to now, but in Uniswap V3 on both Ethereum and Polygon, the fee tier 0.05% is used the most. My data parameter applied to the 90 days range for most token pairs showed that the second highest market is for the pair of MATIC/USDC since MATIC is the native token of the Polygon chain with a $1.67b trading volume. In the top five markets on V3 Polygon, there is no fee tier of 0.3%, even though since the beginning of its release, most new markets were created using this fee tier (Fig. 69). Polygon V3’s liquidity is accumulating more. On the launch day, only $180k was funded for a liquidity campaign, and four months later, V3 Polygon captained about $112.12m of liquidity, 622 times higher than before (Fig. 70). Breaking down into fee tier, most liquidity of V3 Polygon concentrated on 0.05% fee tier (Fig. 71).

As of 5 June 2022, about $82m of total value is locked in Uniswap V3 Polygon in which 81.3% of the TVL is for the fee-tier of 0.05% ,  21.1% of TVL  is for  a 0.3% fee and 12.2 % for a 0.1% fee (Fig. 72). Due to its contribution, the liquidity providers get the most return on the fee-tier 0.05% (Fig. 73). Taking the top market of USDC/WETH with the 0.05% fee as an example, so far, the investors have gained 26.25% of cumulative yield (Fig.74).

Fig. 69. The number of market supported on Uniswap V3 Polygon

Fig. 70. Liquidity value of V3 Polygon


Fig. 71. Liquidity value of V3 Polygon by fee tiers

Fig. 72. The total value locked in V3 Polygon by the fee-tiers 


Fig. 73. The fee share on Uniswap V3 Polygon 


Fig. 74. The cumulative yield of USDC/WETH - 0.05% in Uniswap V3 Polygon

Comments

Popular posts from this blog

Uniswap V3 Breakdowns - State of adoption in DEX (P.8)

  On 23 March 2021, Uniswap team announced the details of their upcoming V3 release but it officially launched on 5 May 2021.  As a result, all analysis of Uniswap V3 would take place from May 2021 onwards.  Fig. 47.  Number of market supported on Uniswap V3 A day after its launch, about 280 new pools were formed in which the 0.3%-fee market had 151 pools because users were becoming accustomed to the general fee of the previous version. Besides, users also created many new pools in the 1%-fee market with 99 new pools. Other lower fee tiers were not of favor to liquidity providers, 0.05%-fee market has only 31 new ones, while no pool was in 0.01%-fee market. Up to now, the number of pools created on V3 has been fairly limited, averaging only about 2 to 20 pools established daily (Fig. 47). It is insignificant when compared to V2.  Fig. 48. Daily positions created in Uniswap V3 in May 2022 In May 2022, on average, more than 300 positions were generated every day;...

State of adoption in DEX (P.10)

  A powerful incentive of AMM-based DEX for liquidity provision The results from analyzing the operation of Uniswap V2 and V3 reveal answers to the research question. In most circumstances, exchange operators have a motivation to attempt to and enhance the observed volume on a certain exchange. Increased volume indicates increased liquidity and trust, which will attract more people. This motivation may differ for completely decentralized exchanges, but it is a significant aspect to consider for most existing ones. According to the previous section, V3 market is extremely active when gradually occupying the market share of its predecessor, especially recently when the number of users participating as traders in both versions has become equal. Although the number of pairs made on V3 cannot be compared with a huge variety of pairs on V2, it does not affect the number of swaps executed on V3, particularly in May 2022. All these aspects are facilitating V3 to be an attractive market for...