On 23 March 2021, Uniswap team announced the details of their upcoming V3 release but it officially launched on 5 May 2021. As a result, all analysis of Uniswap V3 would take place from May 2021 onwards.
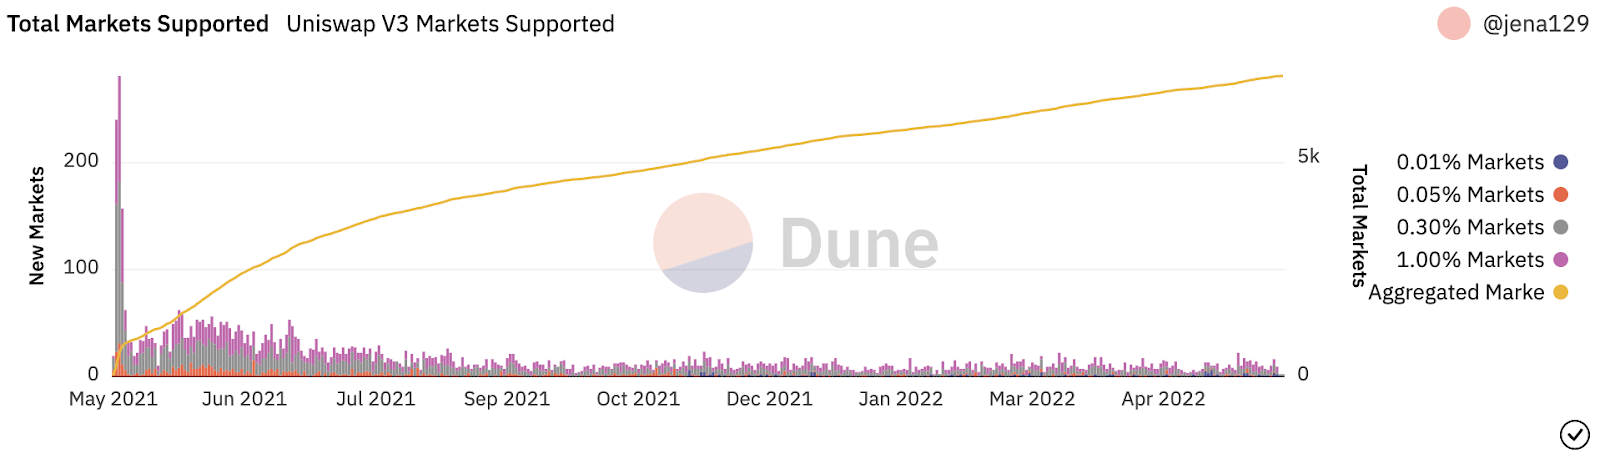
Fig. 47. Number of market supported on Uniswap V3
A day after its launch, about 280 new pools were formed in which the 0.3%-fee market had 151 pools because users were becoming accustomed to the general fee of the previous version. Besides, users also created many new pools in the 1%-fee market with 99 new pools. Other lower fee tiers were not of favor to liquidity providers, 0.05%-fee market has only 31 new ones, while no pool was in 0.01%-fee market. Up to now, the number of pools created on V3 has been fairly limited, averaging only about 2 to 20 pools established daily (Fig. 47). It is insignificant when compared to V2.
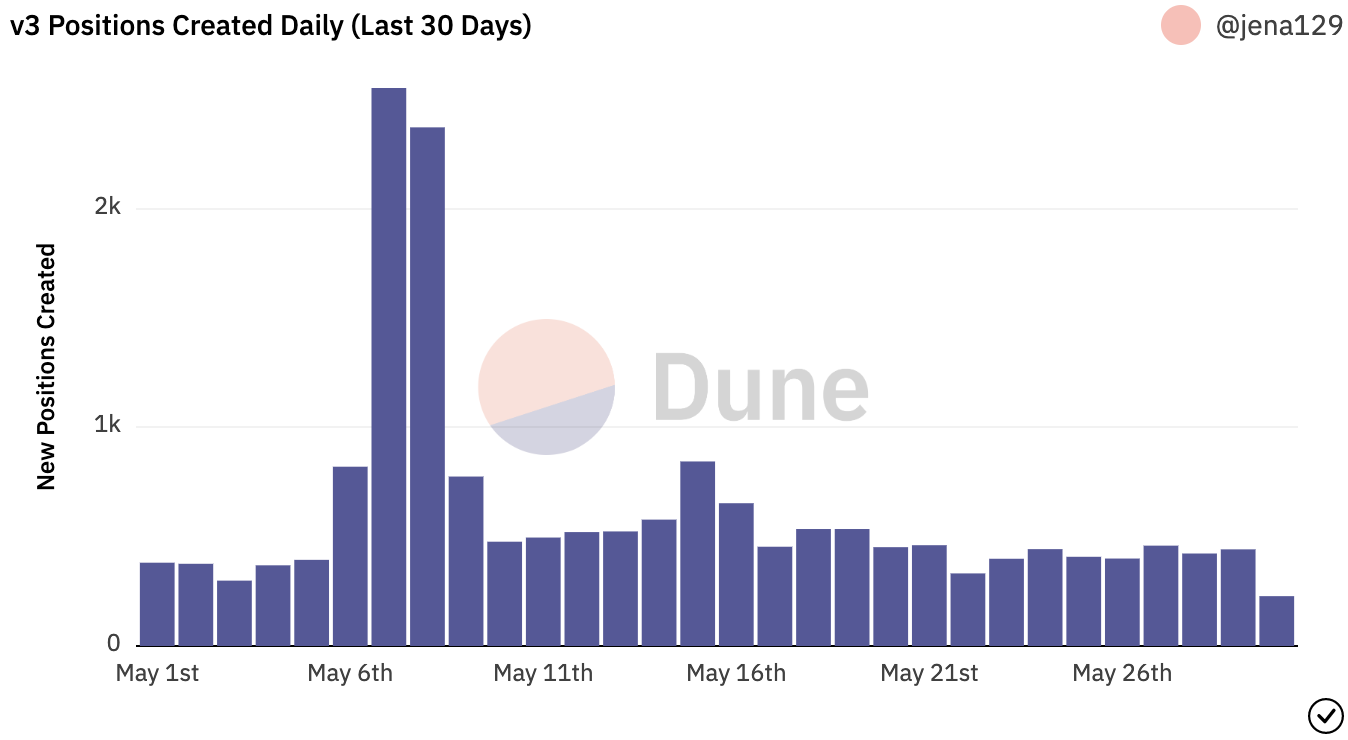
Fig. 48. Daily positions created in Uniswap V3 in May 2022
In May 2022, on average, more than 300 positions were generated every day; in particular, the number of positions created on the 7th and 8th of May was 2552 and 2372, respectively, which is significantly greater than the rest of the month (Fig. 48). Only 30% of the positions set in Uniswap V3 were within the range orders, meaning that the market price of the token always passed through the range orders of the remaining 70% of positions (Fig. 49).
The amount of gas used for processing transactions has kept stable since the launch of V3. In some cases, to deal with more swaps, a large amount of gas was used up to 600 thousand gas (Fig. 50).

Fig. 49. Total positions in range on Uniswap V3 in May 2022
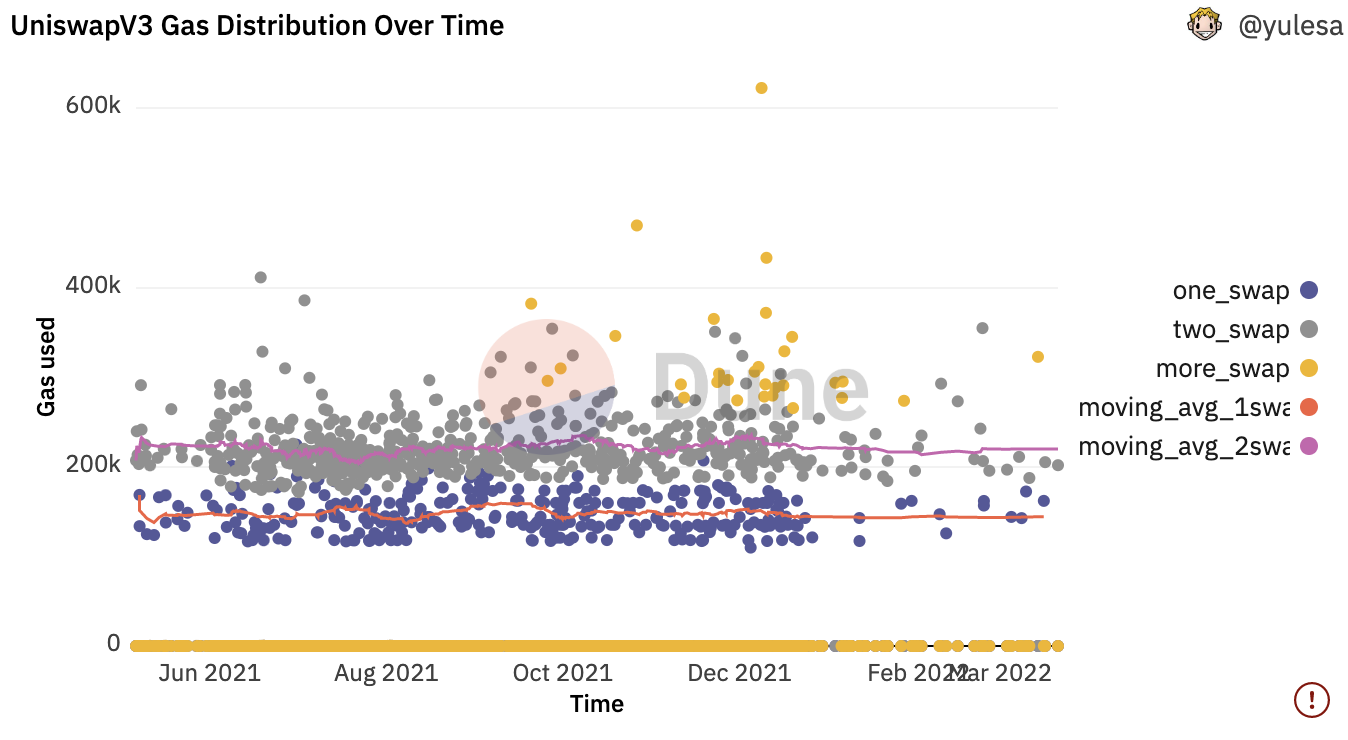
Fig. 50. Gas distribution time series data on Uniswap V3 from May 2021 to Mar 2022

Fig. 51. Total trading volume by Fee tier on Uniswap V3 in the last 7 days (23 May - 29 May, 2022)
When the LPs decide to add liquidity to the pool, they prefer the original trading fee of 0.3%, however, from the trader's viewpoint, they prefer a better fee tier of 0.05%. Consequently, more than 70% of trading volume in the last seven days used a 0.05% fee tier, and the token pairs with a 0.3% trading fee accounted for only 18.9 % of trading volume (Fig. 51). This again raises the question of a balance of interest between both the liquidity providers and the traders in DEXes. Lower fees imply lower prices for end customers, which may benefit the LP in the long run.
Looking at the trading volume by both token pair and fee tier in the last two days (Fig. 52), even though USDC/ETH was the most popular pair, USDC/ETH with a 0.05% fee was a priority which gained 26.2% of total trading volume followed by USDC/ETH and USDT/ETH with a 0.03% fee by respectively 16.8% and 14% of total trading volume.
The fee tier is a very crucial innovation of Uniswap. Deep-dive into the trade volume by fee category (Fig. 53) in the last seven days (from 23 May to 29 May 2022), the most popular token pairs WETH/USDC, WETH/WBTC were dominant in trading volume of both 0.05% and 0.3% fee tier. These two pairs achieved 94.6% market share of trading volume with 0.05% fee, on the other hand, with 0.3% fee, market share of these two pairs was half of that with 0.05% fee, making room for WETH/USDT with 13.3% and WBTC/USDC with 9.9% of total trading volume. The 1.0% fee tier is appropriate for exotic pairs, USDC/HEX pair contributed 19.2% market volume while WETH/LUNA accounted for 14% due to the LUNA crash that happened in May 2022.
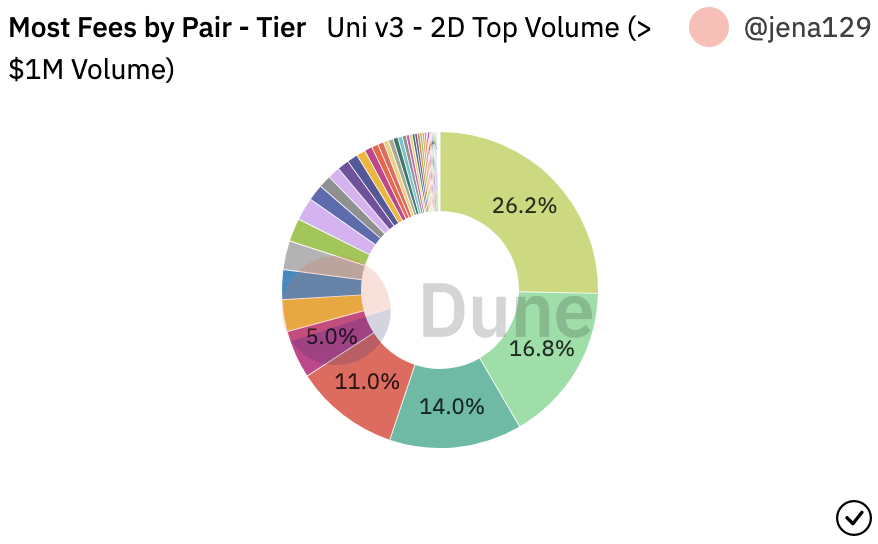

Fig. 52. LP Fees shared by Pair-Fee tier in Uniswap V3 (27 May - 29 May 2022)

Fig. 53. Uniswap trading volume by fee tier in the last 7 days (23 May - 29 May, 2022)
The token pair USDC/WETH is the most popular, and the 0.05% fee is the most prominent, accordingly the pool USDC/WETH 0.05% gained the highest volume in the last 90 days. In the same token pair but different fee tiers, USDC/WETH 0.05% gained 8.2 times higher in trade volume than USDC/WETH 0.3% in Uniswap V3. Although USDC/WETH 0.3% was the most popular token pair in Uniswap V2 (Fig. 37), it achieved only $2.37B of trade volume, this figure was only one-third of the trading volume of the same token pair in Uniswap V3 and was a tiny amount compared with the USDC/WETH 0.05% with $62.6B of trading volume in the last 90 days (Table. 2). It can be seen that the 0.05% fee is creating a huge attraction for traders in Uniswap V3.
However, for the purpose of comparing the capital efficiency between Uniswap V2 and Uniswap V3, this research selects the pool USDC/WETH with 0.3% fee which rank fourth out of top 5 markets in the last 90 days (Table. 2).
Tab. 2. Uniswap V3 Top 5 markets in the last 90 days

Fig. 54. TVL by type of token pairs in Uniswap V3
From Table. 2, the stable pair of USDC/USDT was not the top priority of the majority of traders, they still preferred the four main token pairs to mine the native token UNI. Generally, when Uniswap was launched in May 2021, almost all the token pairs created in the pool were the normal pairs or probably the exotic pairs, however, the daily revenue was mainly earned from the stable pairs, they had contributed up to 96.3% of the total revenue of Uniswap since its launched. At the time of writing, the total value locked (TVL) in the stable pairs almost reached the threshold of equilibrium with the TVL in other pairs, with $1.51B and $1.6B respectively. In contrast, the daily revenue of Uniswap derived from other pairs with 96% of the total revenue, not the stable pairs (Fig. 55)
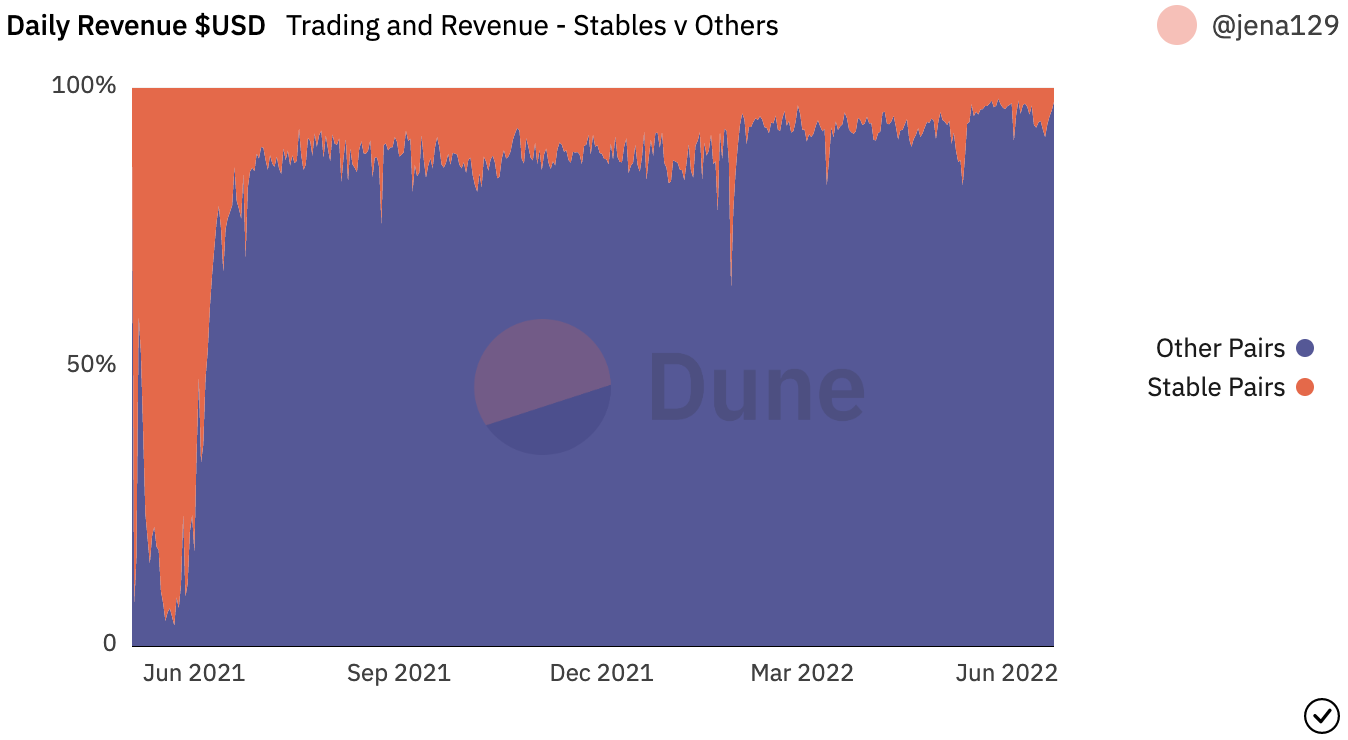
Fig. 55. Daily revenue of Uniswap V3 by token pairs
Except for one stable pair in the top five of the trade volume in the last 90 days, the pair of ETH and stablecoins held the top positions. In Uniswap V2, there was no clear difference between the trade volume of the pair USDC/WETH and USDT/WETH. On the other hand, in Uniswap, USDC/WETH’s trading volume was far ahead of other token pairs in the last seven days, at about $22B on weekdays. The pair of USDT/WETH had just gained around $5.1B on weekdays.
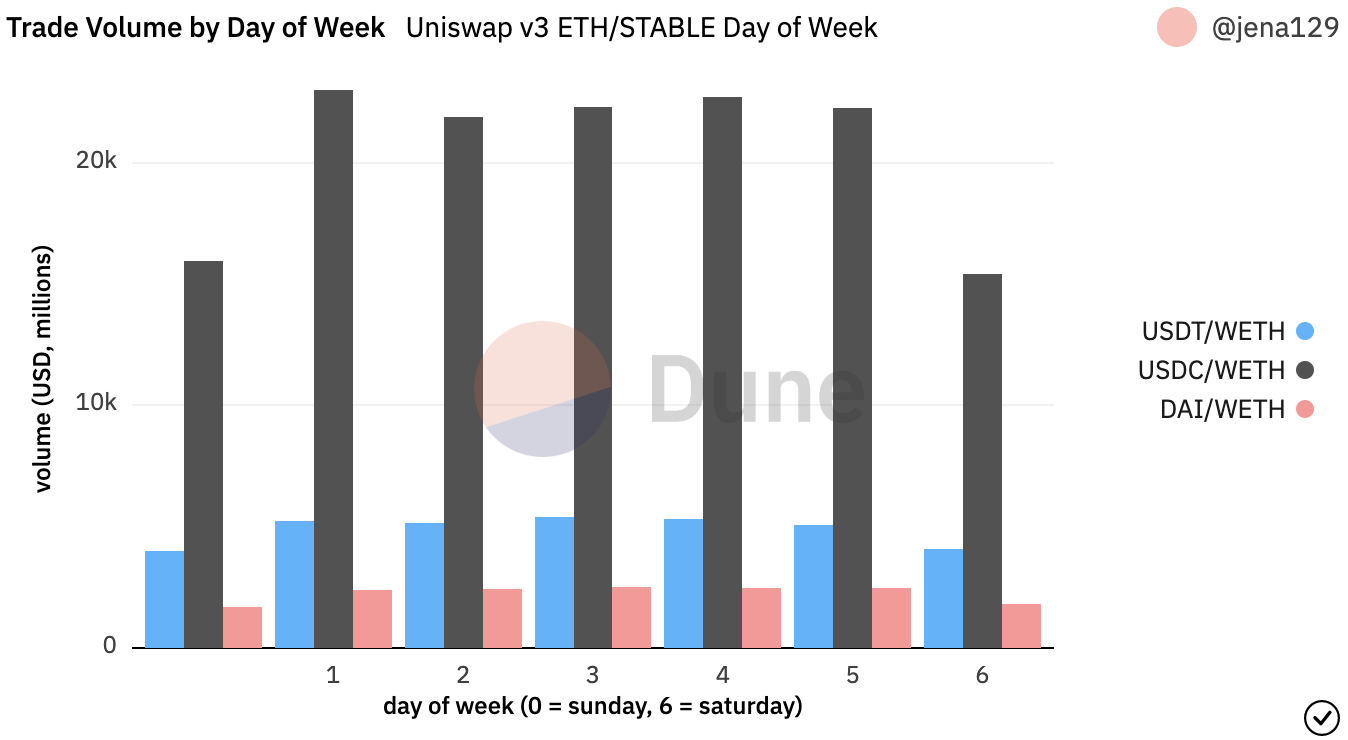
Fig. 56. Trade volume of STABLE/WETH pairs by day of week in Uniswap V3
Example of USDC/ETH pair
In the year since the release of V3, the price of ETH has fluctuated dramatically, falling from a high of $4800 in November 2021 to a low of approximately $1700 in May 2022. For this reason, liquidity of the pool USDC/ETH has stretched from 1000 to 5000 of price range and concentrated the most on the range from 1799 to 2440 (Fig. 57).

Fig. 57. Liquidity distribution of USDC/WETH pair in Uniswap V3

Fig. 58. Price of token A and token B in Uniswap V3
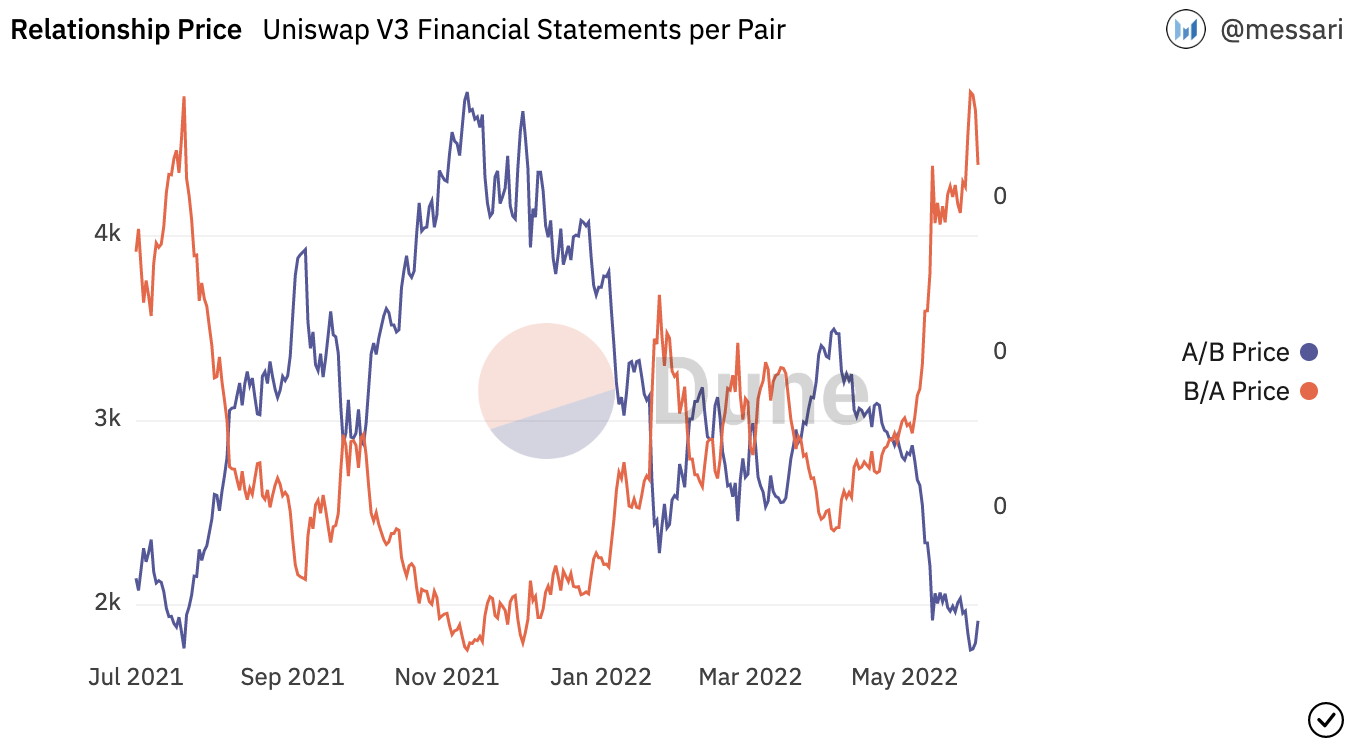
Fig. 59. Exchange rate of token A and token B in Uniswap V3
In both V2 and V3, the token price and exchange rate of the pair USDC/WETH have no discernible change. The reserve value of this pair in V2 has homogeneity with a 50:50 ratio, meanwhile, the value in V3 is always in opposition. For instance, on 2 Sep 2021, about $213.86M worth of USDC covered only $44.31M worth of ETH, consequently, the pool achieved 214.31M USDC and 11.72K ETH (Fig. 52). On 1 Jun 2022, only $31,63M worth of USDC corresponded to $160.53M worth of ETH for an estimated 10:50 ratio in the pool (Fig. 51), meaning that less capital is required in the pool compared with that in V2 and the pool got 31.58M USDC and 85.3K ETH.

Fig. 60. Reserves value of token A and token B in Uniwap V3

Fig. 61. Number of reserves in the pool A/B of Uniswap V3

Fig. 62. Liquidity providers' fee generated from the USDC/WETH pool
As of 1st July 2021, LPs had already earned $66.36M of aggregate fee in V2 for more than one year while they had started to earn only $405.9K of aggregate fee in V3 for two months. Currently, almost eleven months since that date, V3’s liquidity providers have yielded a $109.05M (Fig.62) total fee which is higher than that in V2 with a $100.91M (Fig. 46) total fee on 31st May 2022. With a lower starting point during that period of time, how much profit did LP generate in V3? It is a fact that the aggregate fee has increased almost 270 times in V3 compared with only 1.52 times in V2. It is a really remarkable difference in terms of LP's return. It can be seen that the lower fee is charged, the more volume is traded and the higher return the LPs get. Hence, at the end of May 2022, the accumulated yield of V3 has achieved 59.59% (Fig. 63), meanwhile V2’s has stood at 16.611% (Fig. 47). No matter how volatile the market is, the contribution of liquidity to V3 brings more profits.

Comments
Post a Comment